

A First Friday Season 2 Finale
A Question We’ve Been Chasing Since 2021
It’s the week of the First Friday Season 2 (FFS2) Finale, and the team has spent the past six months communicating the positive impacts of change management in a way that makes people invest in the process.
To start, this challenge is compounded by the term itself: “Change Management.” People’s eyes glaze over as soon as they hear it. If you’ve worked in IT, you know what I’m talking about.
But we know the numbers. 3-7x ROI on Change spend if you follow the recommended 12.5% of project budget spent on the people-side of change. I’d argue this ROI is more impactful than implementing Agentforce.
So why is this point so hard to get across?
Spreadsheets Don’t Tell This Story
First Friday Season 2’s tagline was ‘Change Management for ROI’. We believed that proving out an ROI for Change would get people to pay attention and invest in this space. So how come the needle wasn’t moving?
The problem is that change management’s value lives in what doesn’t happen: the productivity loss you avoided, the adoption timeline you compressed, the rework you never had to do. Those are invisible on a budget. They don’t show up on any invoice.
We needed a way to make that invisible cost visible.
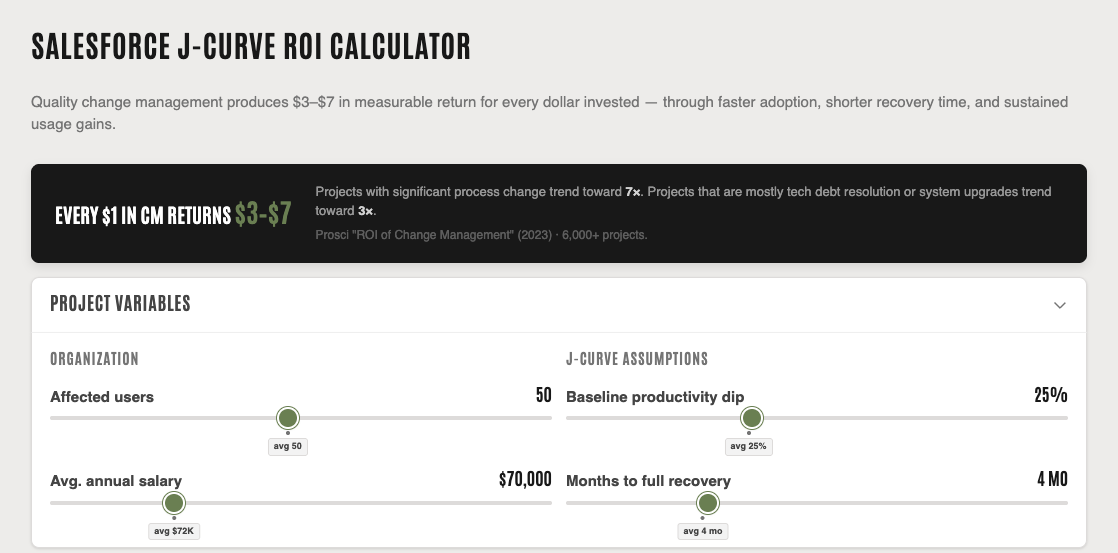
Introducing the J-Curve Calculator
Here’s our next shot at this: the J-Curve Calculator.
The J-Curve is a well-studied model of productivity after a large system change. It’s called a J-Curve because it looks like a J (and also like the Big Dipper).
Productivity drops after go-live, hits a trough, then climbs back to baseline and beyond as the organization fully adopts the new technology and realizes its efficiency gains.
With the J-Curve, we can quantify the impact of the productivity dip after go-live. And with that, we can quantify Change Management’s direct impact in dollars.
The Math for a Mid-Market Salesforce Go-Live
The calculator runs on core assumptions about Salesforce users, standard productivity-loss metrics, and large studies funded by much larger institutions. Here’s the baseline scenario:
Base assumptions — no CM investment | |
|---|---|
Total implementation cost (licenses, consulting fees, time) | $150,000 |
Salesforce users affected | 50 |
Average annual salary per user | $72,000 |
Change management spend | $0 |
Productivity dip at go-live, recovering to baseline by month 4 | 25% |
Monthly baseline labor value | $296,000 |
Cumulative productivity loss | $148,000 |
That $148,000 is the cost of productivity loss with no change management. It never shows up on a project invoice. It comes out of your people, in lost time, workarounds, frustration, and delayed adoption. And it dwarfs the cost of preventing it.
Now what happens if you invest in Change Management at Prosci’s recommended level? At 12.5% of IT spend, which on this project is $18,750:
With Change investment at Prosci’s recommended 12.5% |
|---|
CM spend: $18,750 |
3× return on CM spend: $56,250 |
Productivity dip reduces from 25% → ~19% |
Recovery accelerates from 4 months → ~2.5 months |
Net improvement: ~$95,000 on an $18,750 investment |
The change management investment is smaller than most project change orders. The return is larger than most people expect.
Why This Matters
At First Friday, it has always been our mission to help people understand the value of change work in their Salesforce implementations. The J-Curve does this because it puts the cost of doing nothing right next to the cost of doing something, in the same chart, with numbers the client recognizes as their own.
The $3–$7 return is real. The productivity loss is real. The only thing that’s been missing is a way to show both at once.
That’s what we built this season.
Try this scenario in the J-Curve calculator
The calculator will show you the impact of investment in your Change program against productivity loss after a system change.
Opens in any browser, no login required.